

What is JSON file?
JSON stands for JavaScript Object Notation. It is a standard text-based format that represents structured data based on JavaScript object syntax. It is used for transmitting data in web applications (Example: sending some data from the server to the client or vice versa, so it can be displayed on a web page).
It can be used independently from JavaScript, and many programming environments feature the ability to read (parse) and generate JSON.
JSON exists as a string that is useful when you want to transmit data across a network. It needs to be converted to a native JavaScript object when you want to access the data. JavaScript provides a global JSON object that has methods available for converting between the two.
A JSON string can be stored in its own file, which is basically just a text file with an extension of .json, and a media type of application/json and It is more simple and lightweight compared to Xml.

Structure or unstructure data?
Structured data is a pre-defined data model and is straightforward to analyze. Structured data conforms to a tabular format with relationship between the different rows and columns. Common examples of structured data are Excel files or SQL databases. Each of these have structured rows and columns that can be sorted.
Structured data depends on the existence of a data model – a model of how data can be stored, processed and accessed. Because of a data model, each field is discrete and can be accesses separately or jointly along with data from other fields. This makes structured data extremely powerful: it is possible to quickly aggregate data from various locations in the database.
Structured data is is considered the most ‘traditional’ form of data storage, since the earliest versions of database management systems (DBMS) were able to store, process and access structured data.
Unstructured Data
Unstructured data is information that either does not have a predefined data model or is not organized in a pre-defined manner. Unstructured information is usually text-heavy, but may contain data such as dates, numbers, and facts as well. This results in ambiguities that make it difficult to understand using traditional programs as compared to data stored in structured databases. Common examples of unstructured data include audio, video files or No-SQL databases.
The ability to analyze unstructured data is especially relevant in the context of Big Data, since a large part of data in organizations is unstructured. Think about pictures, videos or PDF document. The ability to extract value from unstructured data is one of main drivers behind the quick growth of Big Data.
Semi-structured Data
Semi-structured data is a combination of both where form of structured data that does not conform with the formal structure of data models associated with relational databases or other forms of data tables, but nonetheless contain tags or other markers to separate semantic elements and enforce hierarchies of records and fields within the data. Therefore, it is also known as self-describing structure. Examples of semi-structured data include JSON and XML are forms of semi-structured data.
The reason that this third category exists (between structured and unstructured data) is because semi-structured data is considerably easier to analyse than unstructured data. Many Big Data solutions and tools have the ability to ‘read’ and process either JSON or XML. This reduces the complexity to analyse structured data, compared to unstructured data.
Case study : Twitter Sentiment Analysis API

A B2C business owner would like to find out the sentiment of their new product launch via Social media. It is a good platform for business to gather useful information about what consumer are saying and feeling as it enable business to know the trends, customer needs and wants and therefore a product suitability.
Twitter APIs is a good example of returning Tweets provide that data encoded using JavaScript Object Notation (JSON). JSON is based on key-value pairs, with named attributes and associated values. These attributes, and their state are used to describe objects.
Twitter serve many objects as JSON, including Tweets and Users. These objects all encapsulate core attributes that describe the object. Each Tweet has an author, a message, a unique ID, a timestamp of when it was posted, and geo metadata shared by the user. Each User has a Twitter name, an ID, a number of followers, and most often an account bio.
With each Tweet we also generate “entity” objects, which are arrays of common Tweet contents such as hashtags, mentions, media, and links. If there are links, the JSON payload can also provide metadata such as the fully unwound URL and the webpage’s title and description.

{
  "created_at": "Thu Apr 06 15:24:15 +0000 2017",
  "id_str": "850006245121695744",
  "text": "1/ Today weu2019re sharing our vision for the future of the Twitter API platform!nhttps://t.co/XweGngmxlP",
  "user": {
    "id": 2244994945,
    "name": "Twitter Dev",
    "screen_name": "TwitterDev",
    "location": "Internet",
    "url": "https://dev.twitter.com/",
    "description": "Your official source for Twitter Platform news, updates & events. Need technical help? Visit https://twittercommunity.com/ u2328ufe0f #TapIntoTwitter"
  },
  "place": {
  },
  "entities": {
    "hashtags": [
    ],
    "urls": [
      {
        "url": "https://t.co/XweGngmxlP",
        "unwound": {
          "url": "https://cards.twitter.com/cards/18ce53wgo4h/3xo1c",
          "title": "Building the Future of the Twitter API Platform"
        }
      }
    ],
    "user_mentions": [
    ]
  }
}
Visualizing the Results in BI tools
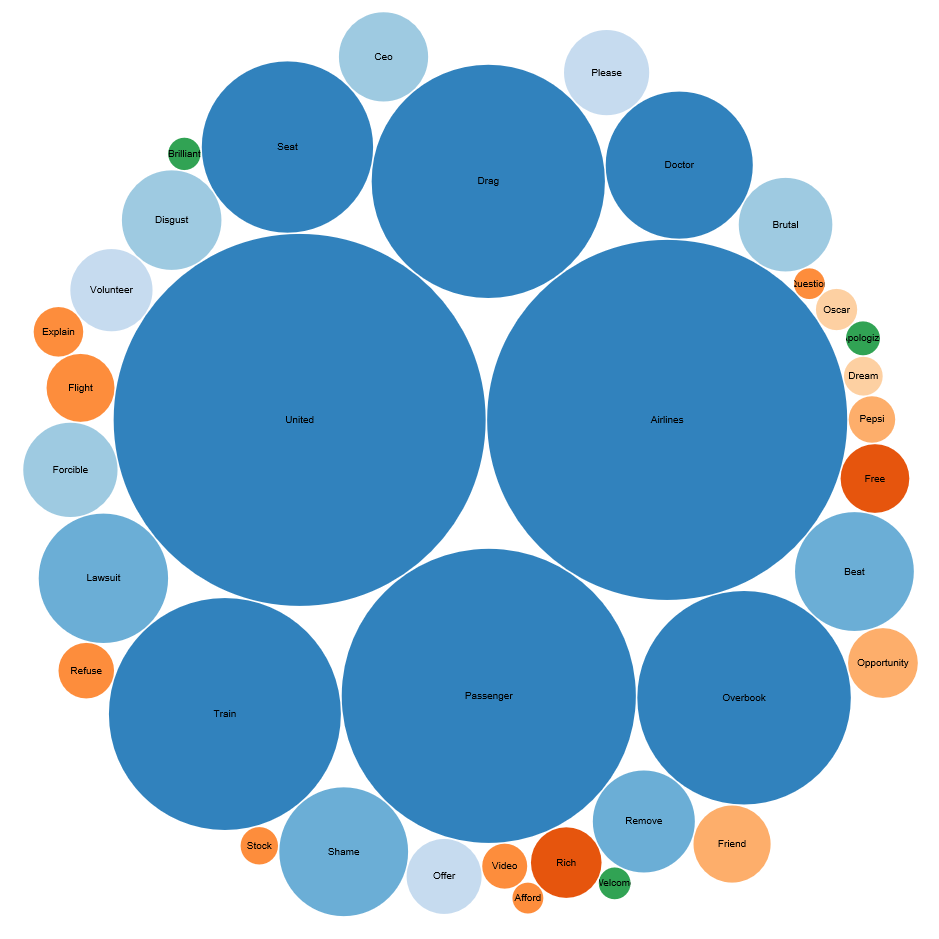
Sentiment analysis can also discover the most frequently used words among positive, negative or neutral tweets. In the chart above, the larger the size of the bubble indicates the higher frequency of the word appearing in a set of tweets. From the bubble chart, we can see the most frequent words in negative tweets (you can choose to see positive or negative tweets).
If you like to know how you can convert the sentiment analysis data to BI tools, you can reach out to us :)
Summary
